3.1.1. Use of post offices
https://www.anacom.pt/render.jsp?contentId=79945
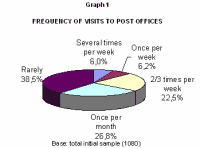
Most of those interviewed stated that they rarely went to post offices (39%), or only once a month (27%).
(click on the image to see the Graph)Regarding the times of the day when those interviewed normally go to post offices: the greatest number (38%) stated that they do so between 9:00 and 12:00, followed by the period between 14:00 and 17:00 (36%) and then the period between 12:00 and 14:00 (12%).
https://www.anacom.pt/render.jsp?contentId=79946
3.1.2. Use of postal services in post offices1
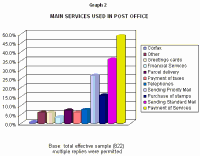
In the post offices, the most requested services are those related to sending letters (615) and payment of services (48%).
(click on the image to see the Graph)Regarding the telephone service available at post offices, 45% of those interviewed stated that they use it. Of these, 97% considered the organisation of the service in terms of queuing time to be positive (both to request a call and to pay for the call).
Around 62% of those polled considered that the services that are currently available in post offices are sufficient. Nonetheless, those polled suggested that the following additional services should be provided in post offices:- The ATM (Multibanco) service; submission of tax returns (IRS); purchase of car stamp duty; submission of lottery tickets (totoloto/totobola); sale of newspapers/magazines; Internet access; renewal of Identity cards; banking services; services specifically catering to elderly people and payment of house rent.
3.1.3. Use of postal services
https://www.anacom.pt/render.jsp?contentId=79947
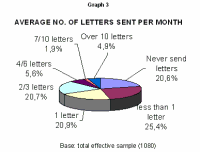
Around 47% of those polled send a maximum of one letter per month. 21% of respondents never send correspondence.
The main reason identified for this limited use of the postal services was preference for use of the telephone (54%).
(click on the image to see the Graph)3.1.4. The new postcodes
Amongst those polled, around 22% are unaware of the number of digits in the new postcode (7). Around 64% of respondents correctly responded to this question.
It should be noted that 40% of those polled claim that they do not use the new postcodes, and 41% of this group justify this behaviour by the fact that they never or only rarely send letters. 26% of this group justify their behaviour because they do not know the new postcodes.
3.1.5. Customer support servicesParticipants in this opinion poll were questioned regarding their use of the freephone customer support telephone service, the CTT Internet site, and the complaints service available in post offices.
The majority of respondents (80%) are unaware of the freephone customer support telephone service, and this lack of knowledge is even higher in the Greater Oporto Area (88%).
Of those that are familiar with the service, 23% have already used it, and the majority (88%) are satisfied with the clarifications provided.
Around 25% are aware of the existence of CTT's Internet site, and this awareness is even greater in the Autonomous Regions of Azores and Madeira, and the Greater Oporto Area and Greater Lisbon Area. Amongst those consumers that know of the existence of the site, only 6% have already consulted it, having done so for various reasons including general curiosity and identification of postcodes. Amongst those individuals that have already consulted the CTT's site, 77% claim to be satisfied with the presentation of information in the site.
Around 34% of respondents claim that they know of the existence of a complaints service in post offices, and 5% have made use of such services. The main motivation for presentation of complaints was in regards to errors in the distribution of correspondence. Amongst those individuals that have made complaints, 56% were not satisfied with the resolution of the complaints filed, mainly because they considered that there was either no solution to the problems presented or because nothing changed as a result.
By contrast, 31% of those filing complaints were satisfied with the solution of their complaint.
3.1. Level of use of post offices and postal services
/
Updated on 24.01.2003


