Trends in complaints
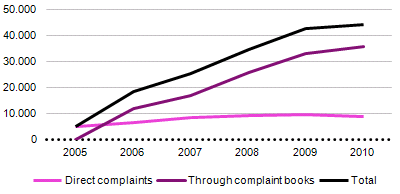
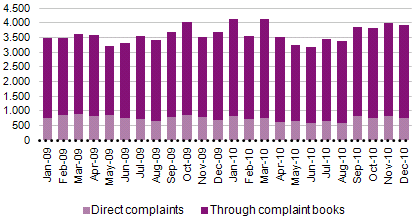
In 2010, ICP-ANACOM received 44,108 complaints, 5 percent more than it received in the previous year. As such, the average monthly number of complaints rose from 3,500 in 2009 to 3,675 in 2010.
This increase continues to be due largely to the widespread use of the complaint books, the rules 1 for which entered into force on 1 January 2006, with an increase of 9.7 per cent reported in the volume of complaint sheets received. It should be noted, however, that the growth in the volume of complaints submitted in this fashion slowed significantly in 2010, with an increase reported of 31 percent in 2009.
Graph 41 - Evolution in the annual volume of
complaints by type of entry (2005-2010)
Source: ICP-ANACOM.
Graph 42 - Evolution in the monthly volume of
complaints by type of entry (2009-2010)
Source: ICP-ANACOM.
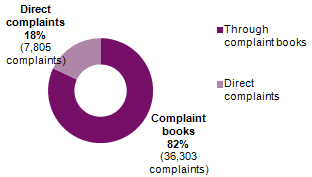
In 2010, complaints entered in complaint books represented around 82 percent of all complaints received by this Authority, with the proportion of such complaints growing by 3.5 percent over the previous year.
Graph 43 - Complaints by type of entry
Source: ICP-ANACOM.
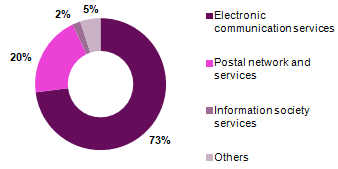
In terms of sector, as in previous years, most of the complaints referred to the electronic communications sector.
Graph 44 - Complaints by sector
Source: ICP-ANACOM.
Electronic Communications
In 2010, ICP-ANACOM received 32,224 complaints about electronic communications services, representing an increase of 0.2 percent over the previous year. The Internet access service gave rise to the largest number of complaints per 1,000 customers (2.40), though 0.87 fewer compared to 2009. This is followed by the fixed telephone service (2.21), which also decreased by about 0.31, and the subscription television service (2.14), which registered a slight increase of 0.4.
|
|
Service |
2010 |
Customers |
Complaints per 1000 |
|
1. |
Internet Access Service |
10,593 |
4,409,356 |
2.40 |
|
2. |
Telephone service at a fixed location |
7,649 |
3,465,907 |
2.21 |
|
3. |
Subscription Television Service |
5,673 |
2,652,899 |
2.14 |
|
4. |
Virtual Calling Card Service |
15 |
9,221 |
1.63 |
|
5. |
Public payphone service |
48 |
32,413 |
1.48 |
|
6. |
Mobile Telephone Service |
8,393 |
11,919,143 |
0.70 |
|
7. |
Voice over Internet Service (VoIP) |
42 |
106,778 |
0.39 |
Source: ICP-ANACOM.
Among the subjects giving rise to most complaints in the electronic communications sector, issues related to equipmet, billing, customer service, contracts and faults continue to predominate, even while decreases have been reported in all these matters, compared to 2009, except for complaints concerning faults which increased by 4 percent.
Among complaints about equipment, issues related to the unlocking of equipment used to access electronic communications services had a strong presence in the second half of 2010; this matter is governed by Decree-Law no. 56/2010 of 1 June.
|
Subject |
2009 |
2010 |
Variation % |
|
Equipment |
7,434 |
7,351 |
-1% |
|
Billing |
7,507 |
7,234 |
-4% |
|
Customer service |
6,321 |
5,850 |
-7% |
|
Contract |
5,391 |
4,960 |
-8% |
|
Faults |
4,471 |
4,646 |
4% |
|
Cancellation of service |
3,113 |
3,845 |
24% |
|
Supply of initial connection |
4,019 |
3,523 |
-12% |
|
Technical Support |
6,221 |
3,137 |
-50% |
|
Tariffs |
2,245 |
2,893 |
29% |
|
Suspension of service |
2,134 |
2,075 |
-3% |
|
Portability |
1,487 |
1,154 |
-22% |
|
Speed |
1,004 |
931 |
-7% |
|
Complaint Books |
195 |
259 |
33% |
|
Infrastructure |
249 |
250 |
0% |
|
Privacy and personal data |
196 |
243 |
24% |
|
Roaming |
177 |
169 |
-5% |
|
Selection and pre-selection |
110 |
80 |
-27% |
|
Directories and information services |
30 |
40 |
33% |
|
Numbering |
41 |
28 |
-32% |
|
Local loop unbundling |
50 |
26 |
-48% |
|
Municipal Fee for Rights of Way (MFRW) |
7 |
16 |
129% |
|
Geographic portability |
141 |
14 |
-90% |
Source: ICP-ANACOM.
Meanwhile, the relative position 2 of each electronic communications provider in terms of volume of complaints compared to total complaints received at ICP-ANACOM is detailed in the following tables. ICP-ANACOM's concern for consumers led it to decide to disclose, for the first time in 2010, data on complaints from providers of electronic communications. This is information that is relevant to the market, since it can help consumers make more informed choices.
|
Band |
Providers of telephone service at a fixed location |
Change on 2009 |
|
|
A |
ZON - TV Cabo Madeirense, S.A. |
↔ |
|
|
B |
CABOVISÃO - Televisão por Cabo, S.A. |
↔ |
|
|
OPTIMUS - Comunicações, S.A. |
↑ |
||
|
C |
AR Telecom – Acessos e Redes de Telecomunicações, S.A. |
↓ |
|
|
PT Comunicações, S.A. |
↔ |
||
|
ZON - TV Cabo Açoreana, S.A. |
↓ |
||
|
VODAFONE PORTUGAL - Comunicações Pessoais, S.A. |
↔ |
||
|
ZON - TV Cabo Portugal, S.A. |
↑ |
||
|
UNITELDATA - Telecomunicações, S.A. |
↑ |
||
|
D |
PT PRIME - Soluções Empresariais de Telecomunicações e Sistemas, S.A. |
↔ |
|
|
G9SA - Telecomunicações, S.A. |
↓ |
||
|
TMN - Telecomunicações Móveis Nacionais, S.A. |
↔ |
||
|
REFER TELECOM - Serviços de Telecomunicações, S.A. |
↓ |
||
Source: ICP-ANACOM.
|
Band |
Providers of fixed Internet access service |
Change on 2009 |
|
A |
ZON - TV Cabo Madeirense, S.A. |
↔ |
|
NORTENET - Sistemas de Comunicação, S.A. |
↑ |
|
|
PT PRIME - Soluções Empresariais de Telecomunicações e Sistemas, S.A. |
↔ |
|
|
B |
UNITELDATA - Telecomunicações, S.A. |
↓ |
|
CLARA.NET PORTUGAL - Telecomunicações, S.A. |
↓ |
|
|
CABOVISÃO - Televisão por Cabo, S.A. |
↑ |
|
|
AR Telecom - Acessos e Redes de Telecomunicações, S.A. |
↔ |
|
|
C |
ZON - TV Cabo Portugal, S.A. |
↔ |
|
ZON - TV Cabo Açoreana, S.A. |
↓ |
|
|
OPTIMUS - Comunicações, S.A. |
↔ |
|
|
D |
PT Comunicações, S.A. |
↔ |
|
VODAFONE PORTUGAL - Comunicações Pessoais, S.A. |
↔ |
|
|
TMN - Telecomunicações Móveis Nacionais, S.A. |
↔ |
Source: ICP-ANACOM.
|
Band |
Providers of mobile communication services |
Change on 2009 |
|
|
A |
VODAFONE PORTUGAL - Comunicações Pessoais, S.A. |
↔ |
|
|
CTT - Correios de Portugal, S.A. |
↔ |
||
|
TMN - Telecomunicações Móveis Nacionais, S.A. |
↑ |
||
|
OPTIMUS - Comunicações, S.A. |
↑ |
||
|
D |
ZON - TV Cabo Portugal, S.A. |
↔ |
|
Source: ICP-ANACOM.
|
Band |
Subscription television service providers |
Change on 2009 |
|
|
A |
ZON - TV Cabo Madeirense, S.A. |
↔ |
|
|
ZON - TV Cabo Açoreana, S.A. |
↔ |
||
|
B |
UNITELDATA - Telecomunicações, S.A. |
↑ |
|
|
CABOVISÃO - Televisão por Cabo, S.A. |
↔ |
||
|
AR Telecom - Acessos e Redes de Telecomunicações, S.A. |
↔ |
||
|
ZON - TV Cabo Portugal, S.A. |
↔ |
||
|
C |
PT Comunicações, S.A. |
↔ |
|
|
D |
OPTIMUS - Comunicações, S.A. |
↔ |
|
|
VODAFONE PORTUGAL - Comunicações Pessoais, S.A. |
↔ |
||
Source: ICP-ANACOM.
|
Category |
Complaints per 1000 customers |
Position compared to 2009 |
|
A |
0 > and < 0.99 |
Maintained 2009 category ↔ |
|
B |
0.99 ≥ and < 1.95 |
Improvement over 2009 category ↑ |
|
C |
1.95 ≥ and < 3.54 |
Decline over 2009 category ↓ |
|
D |
≥ 3.54 |
(the colours indicate the 2009 category) |
Postal Network and Services
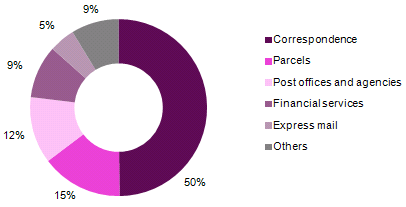
In 2010, a total of 8,753 complaints were registered with respect to the postal sector, representing an increase of about 20 percent over 2009; these complaints were driven mainly by the correspondence service which gave rise to 4,270 complaints, about 54 percent more than in the previous year.
Graph 45 - Complaints about the postal sector, by service
Source: ICP-ANACOM.
The subject giving rise to the most complaints was customer service, with 2,911 complaints reported; these complaints are typically associated with users visiting service provider outlets, reflecting the weight of complaints submitted using complaints books in the total volume of complaints presented to this Authority (about 98 percent). Other matters giving rise to most complaints in this period were lack of attempted delivery at home (1,455 complaints), loss (1,002 complaints), delivery at the wrong address (865 complaints) and delayed delivery (863 complaints).
Information Society Services
Among information society services, the largest number of complaints referred to message-based valued added services, with 894 complaints recorded in 2010, representing about 92 percent of all complaints sent to this Authority on those services. The main issues raised in these complaints were the alleged lack of subscriber consent as to provision of the service and failure to bar services by the support provider or delay in the implementation of barring.
1 Decree-Law no. 156/2005 of 15 September, as amended by Decree-Law no. 371/2007 of 6 November, by Decree-Law no. 118/2009 of 19 May.
2 The bands were defined with reference to the quartiles for 2010 based on the indicator of number of complaints per thousand customers, with each operator classified based on its ratio.


