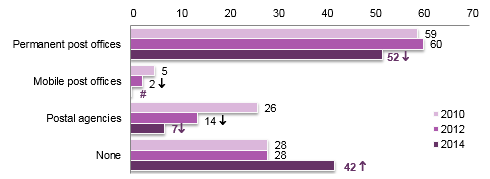
During 2014, 52 percent of all individuals in Portugal used permanent post offices. The remaining users used mobile post offices and postal agencies. Around 42 of those surveyed did not use the postal network.
In terms of user numbers, declines were reported for all points of access to the network.
Graph 1 - Percentage of users of network providing service to public

Unit: %
Source: ICP-ANACOM, Survey on the use of postal services, December 2010, 2012 and 2014
Base: Individuals aged 15 years or older (excludes non-responses)
Note 1: Estimates: (#) Unreliable estimate; (*) Acceptable estimate; (no symbol) Reliable estimate. 1
Note 2: Multiple choice question
Note 3: An upward pointing arrow signals a statistically significant increase between t-1 and t, and a downward pointing arrow signals a statistically significant decline.2
Users of post offices and postal agencies mostly used branches located in their area of residence (89.6 percent), and to a lesser extent branches located near their workplace (5.5 percent) and in the district nearest their area of residence (4.7 percent).
Services used in post offices and postal agencies
“Sending / receiving registered mail” was the service most used (41.6 percent) by users of post offices or postal agencies during 2014, followed by ''sending / receiving parcels'' and "sending correspondence (non-priority, priority, pre-paid or express)”. In addition to traditional postal services, a significant portion of those surveyed cited payments and money transfers (payment of services/taxes/road tolls; postal orders and transfers; mobile phone account top-ups) among the most frequently used services.
|
|
Use |
|
Sending/receipt of registered mail |
41.6 |
|
Sending/receipt of parcels |
32.1 |
|
Sending correspondence (non-priority, priority, prepaid , express) |
31.2 |
|
Payment of services/taxes |
26.8 |
|
Postal orders and money transfer (includes receipt of pensions) |
14.7 |
|
Mobile phone account top-ups |
8.2 * |
|
Sale of stamps |
7.2 * |
|
Road tolls |
3.7 * |
|
Sale of books, post cards, CDs, DVDs, games or other objects |
2.5 * |
|
Sale of envelopes / padded parcel envelope |
2.4 * |
|
Financial products (includes saving certificates, pension plans, investment funds, assurance funds…) |
2.2 * |
|
Sending telegrams |
# |
Unit: %
Source: ICP-ANACOM, Survey on the use of postal services, December 2014
Base: Individuals aged 15 years or older using post offices or postal agencies
Note 1: Estimates: (#) Unreliable estimate; (*) Acceptable estimate; (no symbol) Reliable estimate.
Note 2: Multiple choice question with option of choosing additional responses.
It is currently possible to acquire a wide range of goods and services at post offices. However, respondents reveal a lack of awareness about the availability of less traditional services: for example, 88 percent of post office and postal agency users did not know about the sale of "lotteries" or "insurance" and around 95 percent of users were unaware of the possibility of purchasing transport tickets. Users are also largely unaware of the following services: "SIGA service", "certification of photocopies", "Internet access" and "requesting waiver of reduced fees in SNS access”.
Average waiting time
Average waiting time, as perceived by users of post offices and postal agencies, was around 14 and 13 minutes respectively, increasing by around 2 minute versus 2012.
Graph 2 - Waiting time at post office and postal agencies

Unit: minutes
Source: ICP-ANACOM, Survey on the use of postal services, December 2010, 2012 and 2014
Base: Individuals aged 15 or over depending on most commonly used branch (excludes non-responses)
Note 1: Margin of error less than 1 minute in post offices and less than 2 minutes in postal agencies
Note 2: An upward pointing arrow signals a statistically significant increase between t-1 and t, and a downward pointing arrow signals a statistically significant decline.
Statistically significant increases have been reported in waiting times for the first time since 2010.
User satisfaction with services provided
"Mail delivered without damage" and “performance of counter staff” were the factors giving rise to highest levels of satisfaction among users of post offices and postal agencies during 2014 (average of 8.6 and 8.5, respectively). Meanwhile, ''accessibility for people with special needs'' and "waiting time" generated the lowest levels of satisfaction (average of 8 and 8.1 respectively).
"Efficiency in delivering mail" and "performance of counter staff" are the two aspects which have most impacted perceived quality (average of 9.4 in both cases), followed by "efficiency in the delivery of mail" (9.39) and working hours (9.38).
Graph 3 - Evaluation of the most important aspects and satisfaction at post offices and postal agencies

Unit: Scale 1 (unimportant / dissatisfied) to 10 (unimportant / satisfied)
Source: ICP-ANACOM, Survey on the use of postal services, December 2014
Base: Individuals aged 15 years or older using post offices or postal agencies (excludes non-responses)
Note: The absolute margins of error in the averages on a scale of 1 to 10 do not exceed 0.1 absolute points in the evaluation of importance and in evaluation of satisfaction.
Notes
1 The coefficient of variation is considered as an indicator for evaluating the sampling error, based on the variance of the ''proportion'' or ''average'' estimator (as appropriate) of a simple random sample. The following classification was used: reliable estimate when the variation coefficient of is under 10 percent; acceptable estimate when the variation coefficient is above or equal to 10 percent and under 25 percent; unreliable estimate when the variation coefficient is above or equal to 25 percent.
2 A statistical test was used of the difference between two proportions for large and independent samples with a confidence level of 95 percent.


