Individuals surveyed received an estimated 5 items of correspondence and around 2 parcels1 during the month of October 2014.
Location for receiving mail
Most correspondence items and parcels were received at home (99 and 77 percent respectively).
Differences were reported with respect to actual vs. desired location for receipt of parcels. Customers receiving parcels at post offices wanted to receive parcels at home and not at post offices.
Graph 6 - Actual and desired location for receiving correspondence and parcels

Unit: %.
Source: ICP-ANACOM, Survey on the use of postal services, December 2014
Base: Individuals aged 15 or over who received correspondence or parcels in their own name during 2014
Note: Estimates: (#) Unreliable estimate; (*) Acceptable estimate; (no symbol) Reliable estimate.
Delivery frequency
Around 87 percent of those surveyed and receiving correspondence or parcels have the perception that post is delivered in the area of their residence on a daily basis.
Around 3 percent said that distribution should take place more than once per day and around 13 percent considered that, in accordance with their needs, the frequency of deliveries in their area of residence could be reduced (once every two days or less frequent).
Average satisfaction with the regularity of post delivery is reported at 8.4 on a scale of 1 (dissatisfied) to 10 (very satisfied) - below the value reported for 2012 (8.6).
Receipt of post, e-commerce and electronic billing
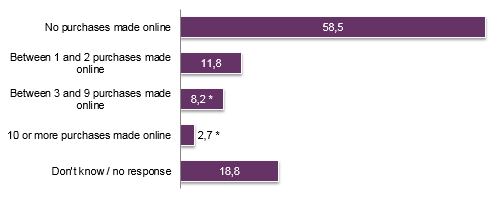
The survey also reveals that 58.5 percent of individual Internet users aged 15 or over made no online purchases or orders during 2014. Only 22.7 percent reported making purchases online.
Graph 7 - Number of online purchase made over last 13 months

Unit: Source: ICP-ANACOM, Survey on the use of postal services, December 2014
Base: Individuals who used the Internet in last 12 months.
Note: Estimates: (#) Unreliable estimate; (*) Acceptable estimate; (no symbol) Reliable estimate.
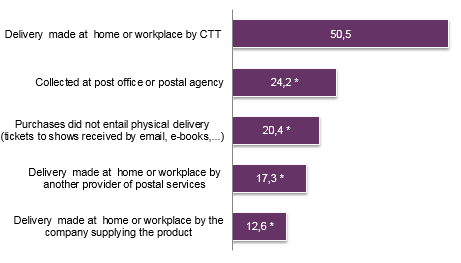
More than half of the individuals who made purchases online indicated that at least one physical delivery was made at their home or workplace by CTT (50.5 percent) or by another provider of postal services (17.3 percent). Around 20.4 percent reported making online purchases that did not entail physical delivery (tickets to shows, e-books, etc.) and 24.2 percent of individuals collected their deliveries at postal establishments.
Graph 8 - Means of delivery of online purchases

Source: ICP-ANACOM, Survey on the use of postal services, December 2014
Base: Individuals who made an online purchase (not including non-responses)
Note 1: Estimates: (#) Unreliable estimate; (*) Acceptable estimate; (no symbol) Reliable estimate.
Note 2: Multiple choice question
In recent years, a trend has been seen involving the substitution of traditional means of billing by electronic billing, a phenomenon which has had a negative impact on postal traffic volume. Among respondents who reported using the Internet, around 19 percent reported using electronic billing services in 2014.
Meanwhile, 34 percent of Internet users are aware of CTT's electronic mail box service (ViaCTT). Of these, around 16 percent have signed up to this means of receiving mail in digital format.
Notes
1 Average number of items of correspondence and parcels interviewee estimates having received.


