3.1. Offer structure and reasons for selecting provider
3.2. Provider switching and number portability
3.1. Offer structure and reasons for selecting provider
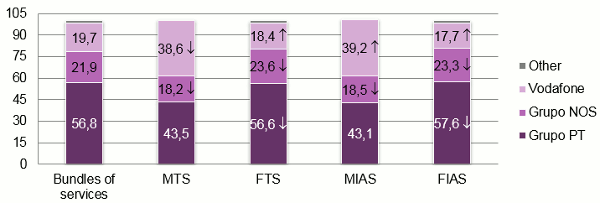
According to the survey, Grupo PT enjoys the highest share of SME customers. Grupo PT's leadership is most pronounced among fixed services, even though its share has been declining.
Grupo NOS is reported in second place in terms of fixed services and bundled services, while Vodafone is the second largest provider when it comes to mobile services and is the provider that has reported most growth in terms of fixed services.
Graph 6 - Percentage of service users by provider
Unit: %
Source: ICP-ANACOM, Survey on the use of electronic communications services, SME, December 2014
Base: Companies with fewer than 250 employees receiving respective service (does not include non-responses)
Note 1: Estimates: (#) Unreliable estimate; (*) Acceptable estimate; (no symbol) Reliable estimate.
Note 2: An upward pointing arrow signals a statistically significant increase between t-1 and t, and a downward pointing arrow signals a statistically significant decline
Note 3: Multiple choice question in MTS and MIAS.
Nota 4: FTS - Fixed telephone service; MTS - Mobile telephone service; FIAS - Fixed Internet access service; MIAS - Mobile Internet access service; STVS - Subscription TV.
|
|
Bundles of services |
MTS |
FTS |
MIAS |
FIAS |
||||
|
2014 |
2012 |
2014 |
2012 |
2014 |
2012 |
2014 |
2012 |
2014 |
|
|
Grupo PT |
56.8 |
40.8 |
43.5 |
66.1 |
56.6↓ |
39.7 |
43.1 |
61.0 |
57.6↓ |
|
Grupo NOS / Optimus/ Grupo ZON |
21.9 |
22.1 |
18.2↓ |
27.0 |
23.6↓ |
28.8 |
18.5↓ |
26.7 |
23.3↓ |
|
Vodafone |
19.7 |
45.5 |
38.6↓ |
9.2 |
18.4 |
35.0 |
39.2↑ |
8.9* |
17.7↑ |
|
Others |
1.6* |
1.1* |
0.4* |
3.9* |
1.5* |
# |
# |
5.1* |
1.5*↓ |
Unit: %.
Source: ICP-ANACOM, Survey on the use of electronic communications services, SME, December 2014
Base: Companies with fewer than 250 employees receiving respective service (does not include non-responses)
Note 1: Estimates: (#) Unreliable estimate; (*) Acceptable estimate; (no symbol) Reliable estimate
Note 2: An upward pointing arrow signals a statistically significant increase between 2012 and 2014 and a downward pointing arrow signals a statistically significant decline.
Note 3: Multiple choice question in MTS and MIAS.
Nota 4: FTS - Fixed telephone service; MTS - Mobile telephone service; FIAS – Fixed Internet access service; MIAS – Mobile Internet access service; STVS – Subscription TV.
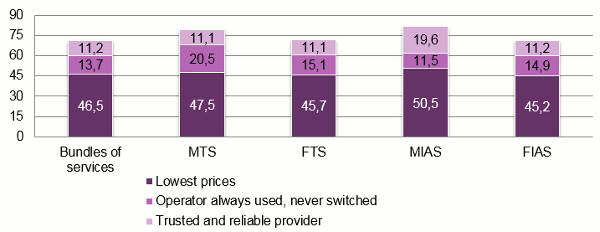
"Lowest prices" is cited as the main reason for choice of provider for all services (between 45.2 percent in case of FIAS and 50.5 percent in case of MIAS).
Graph 7 - Reasons for selecting provider by service (TOP 3)
3.2. Provider switching and number portability
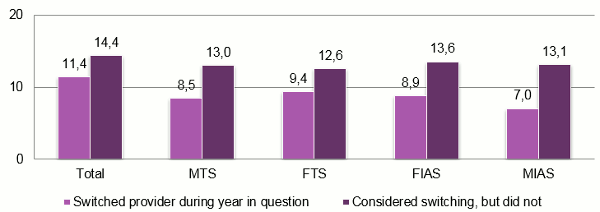
In 2014, the FTS was the service which saw the highest rate of provider switching (9.4 percent, +0.9 percentage points), in line with previous years. The level of provider switching among SMEs is the highest on record in the case of the MTS (8.5 percent, +2 percentage points), FIAS (8.9 percent, +2.6 percentage points) and MIAS (7 percent, + 3.9 percentage points).
Graph 8 - Trends in rates of provider switching
Unit: %.
Source: ICP-ANACOM, Survey on the use of electronic communications services, SME, December 2010, 2012 and 2014
Base: All companies with fewer than 250 staff receiving respective service (does not include non-responses)
Note 1: Estimates: (#) Unreliable estimate; (*) Acceptable estimate; (no symbol) Reliable estimate.
Note 2: An upward pointing arrow signals a statistically significant increase between t-1 and t, and a downward pointing arrow signals a statistically significant decline.
Note 3: FTS - Fixed telephone service; MTS - Mobile telephone service; FIAS – Fixed Internet access service; MIAS – Mobile Internet access service; STVS – Subscription TV.
Among SMEs which switched provider during 2014, 79 percent concluded the contract on the company premises and 87 percent had a 24 month contract lock-in period.
Around 14 percent of the surveyed SMEs were considering switching provider, especially MIAS customers. The main reasons for not switching stem from the existence of a "contract lock-in period with current provider" (65.1 percent) and a "lack of better offers on the market" (13.1 percent).
Graph 9 - Provider switching by service
Unit: %
Source: ICP-ANACOM, Survey on the use of electronic communications services, SME, December 2014
Base: Companies with fewer than 250 staff receiving mobile telephone service (does not include non-responses)
Note 1: All estimates are reliable.
Note 2: An upward pointing arrow signals a statistically significant increase between 2012 and 2014 and a downward pointing arrow signals a statistically significant decline.
Note 3: The total considers all companies giving a response in the respective category for at least one service.
Nota 4: FTS - Fixed telephone service; MTS - Mobile telephone service; FIAS - Fixed Internet access service; MIAS - Mobile Internet access service; STVS - Subscription TV.
The majority of companies (98 percent) were informed about the duration of the contract lock-in period during negotiations, whereas 17 percent were reportedly "unaware of penalties" in the event of early termination or "became aware after contract conclusion".
Assessing the provider switching process on a scale of 1 "very difficult" to 10 "very easy", SMEs gave a rating of 6.3.
The majority of companies switching fixed and mobile telephone service provider during 2014 used the number portability service (89 percent and 87 percent respectively).
According to those surveyed, the number portability process took 1 working day for 44 percent of FTS customers and for 49 percent of MTS customers.


