Current situation:
The current set of density objectives as far as letterboxes are concerned corresponds to those set out in Table 4.
|
1. |
At national level, the concessionaire shall guarantee that the number of inhabitants per geographic point of access to a letterbox is lower than or equal to 1100. |
|
2. a) |
In predominantly urban areas, the number of inhabitants per point of access to a letterbox shall be lower than or equal to 1767 inhabitants per letterbox. |
|
2. b) |
In moderately urban areas, the number of inhabitants per point of access to a letterbox shall be lower than or equal to 881 inhabitants per letterbox. |
|
2. c) |
In predominantly rural areas, the number of inhabitants per point of access to a letterbox shall be lower than or equal to 492 inhabitants per letterbox. |
|
3. |
At national level, the minimum percentage of parishes with at least one letterbox shall be 100% |
Source: ANACOM decision of 28.08.2014.
[Original] proposal submitted by CTT, on 09.03.2017:
CTT proposed to maintain current density indicators of letterboxes, revising nevertheless the respective objectives of indicators 1 and 2 (described in Table 4), proposing: (i) less stringent objectives for the density of letterboxes at national level and in predominantly urban areas; and (ii) more demanding density objectives in moderately urban and predominantly rural areas.
Furthermore, CTT proposed that, for the purpose of the measurement of indicators, consideration was given to points of access with a minimum nine-hour operating period, between 8 am and 10 pm (so far, consideration is given only to those that operate also for at least nine hours, but between 8 am and 6 pm), claiming that this extension takes into account locations where letterboxes are sat, which present increasingly diversified opening hours.
CTT also proposed the use, for this set of indicators, of the urban typology of parishes as classified by INE in 2014 (TIPAU 2014).
ANACOM Decision of 05.06.2017:
ANACOM agreed with proposals presented by CTT, except for objectives on the density of letterboxes in predominantly urban areas and at national level.
ANACOM took also the view that the objective of ensuring one letterbox per parish, currently in force and which CTT proposes to maintain, should be complemented by the obligation to ensure in every parish at least one point of access to letterboxes for deposit of national standard mail (the service most frequently used by users).
[Revised] proposal submitted by CTT, on 18.07.2017:
Compared with its original proposal, CTT:
a) Complements the objective of ensuring one letterbox in every parish with the obligation to ensure, also in every parish, at least one point of access to letterboxes for deposit of national standard mail, in line with the referred ANACOM decision of 05.06.2017.
b) Amends its proposal of objectives of density indicators of letterboxes, to propose the maintenance of objectives currently in force.
As far as this last aspect is concerned, CTT refers that, notwithstanding the recent evolution of postal demand, which in its opinion is characterized by:
i. “The increasingly low use of letterboxes for deposit of postal items, which may be clearly observed in the scope of sealed mail, which is the type of mail deposited…” in letterboxes;
ii. “In the period 2013/2016, sealed (and pre-paid) traffic from the occasional segment, which is the main user of letterboxes, fell by around -24.5%, around double the decline of total addressed traffic…”;
iii. “The relatively low level of use of letterboxes1, as referred in ANACOM Decision (page 21/41), according to data from the study [by ANACOM] on needs of users in accessing postal establishments and other points of access to the postal network, dated May 2017”,
the company accepts to maintain the objectives of density indicators of letterboxes currently in force, both at national level and at the level of the various typologies of areas (predominantly urban areas, moderately urban areas and predominantly rural areas).
c) Maintains remaining elements of the original proposal.
Position taken by ANACOM:
a) Adoption of the TIPAU 2014 typology of urban areas
As referred earlier, ANACOM agrees with the use of the most recent typology of urban areas defined by INE, which corresponds to the so-called TIPAU 2014.
For information purposes, Table 5 presents values which would be achieved by the end of 2016 by applying the TIPAU 2014 typology to the calculation of indicators related to the average number of inhabitants per letterbox, according to the type of area, and it must be referred that values achieved would have met density objectives applicable by the end of 2016.
|
Values achieved by the end of 2016 using the currently applicable area typology |
Values which would have been achieved by the end of 2016 using the TIPAU 2014 typology |
Density objective in force |
|
|
APU |
1638 |
1628 |
≤ 1767 |
|
AMU |
834 |
801 |
≤ 881 |
|
APR |
458 |
461 |
≤ 492 |
Source: ANACOM calculations, taking into account the letterbox network by the end of 2016.
PUA - predominantly urban area; MUA - moderately urban area; PRA - predominantly rural area.
b) Letterboxes to be considered
CTT maintains its proposal that, to measure indicators related to the density of letterboxes, consideration is given only to points [of access] with minimum nine-hour operating period, between 8 am and 10 pm.
ANACOM raises no issues as regards this proposal, as expressed already in its decision of 05.06.2017, stressing that this will allow points of access to letterboxes that are already accessible to users, or which could be in the future, for a minimum daily period of 9 hours (for example from 1 pm to 10 pm), and which today are not considered to be relevant for the purpose of indicators, to be taken into account.
c) Density indicators of letterboxes and respective objective values
CTT proposes to maintain current density indicators of letterboxes, as well as the respective objective values.
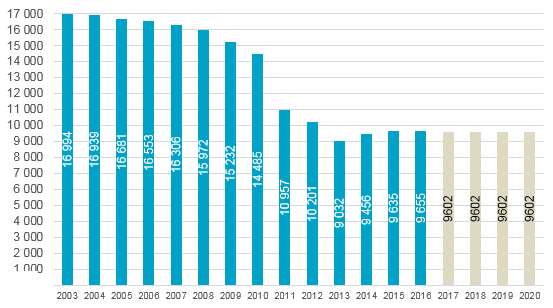
Figure 5 shows the minimum value for letterboxes to be met between 01.10.2017 and 30.09.2020, as results from CTT’s current proposal.
Figure 5 - Evolution in the number of letterboxes (geographic point): up to 2016 (actual); 2017-2020 (minimum value resulting from CTT’s proposal)
Source: Information reported by CTT and ANACOM calculations.
As regards the justification presented, CTT itself estimated that sealed traffic from the occasional segment fell by around -24.5% in the period 2013-20162.
As regards the use of letterboxes, according to the referred 2016 Survey, published by ANACOM in January 2017, of all residential users that used at least one mail service in the last 12 months, 18.4% declared they deposited postal items in letterboxes (vide Table 6).
|
% of respondents* |
|
|
Yes, at post stations/offices only |
81.2 |
|
Yes, both at letterboxes on the public highway and at post stations/offices |
15.9 |
|
Yes, at letterboxes on the public highway only |
2.5 |
|
Do not know/ Do not answer |
0.3 |
|
Mailman |
0 |
|
Elsewhere |
0 |
* Responses to the question: When sending your mail (standard, priority and easy mail) did you deposit it at letterboxes on the public highway or at post stations/offices?
Source: Survey 2016
According to the study on the needs of users in accessing postal establishments and other points of access to the postal network, of May 2017, around 7% of residential users and 12% of business users (micro, small and medium-sized companies) of total customers that used the postal network over the last 12 months refer they used letterboxes, a value which reaches 17.5% in the case of small companies. Although these are not significant values (when compared to the use of postal establishments), it must be stressed that, according to the same study, among users that refer they use letterboxes, 42.2% of residential users and 90.5% of business users refer they use them at least once every month3.
According to the same study, letterboxes are more used in urban areas:
- Letterboxes are used by 9% of residential users in predominantly urban areas who used the network in the last 12 months, 5.1% in predominantly rural areas and 3.4% in moderately urban areas; by 13.2% of companies located in predominantly urban areas, 7.1% in moderately urban areas and 6.7% in predominantly rural areas;
- Letterboxes located outside post stations are used by 7.5% of residential users in predominantly urban areas, 3.9% in moderately urban areas and 3.3% in predominantly rural areas; by 13.2% of companies located in predominantly urban areas, 7.1% in moderately urban areas and 6.7% in predominantly rural areas.
Still according to the same study, it takes longer, in average, to reach a letterbox in rural areas and moderately urban areas than in urban areas.
As such, in the light of the above, CTT’s proposal to maintain the objective values of density of points of access to letterboxes contributes to maintain the level of accessibility to those points of access and, thus, the current levels of quality of the service provided, and it is deemed that CTT’s proposal meets user interests, in a context of decrease of mail traffic, and taking into account that the rate of residential and business users that use letterboxes is not significant. Notwithstanding, it is relevant that those who use letterboxes do so frequently, especially business users (as evidenced above).
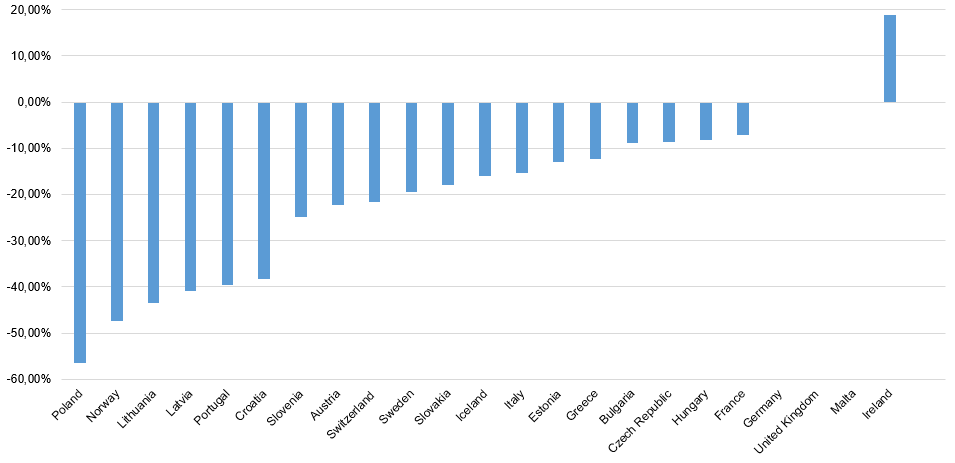
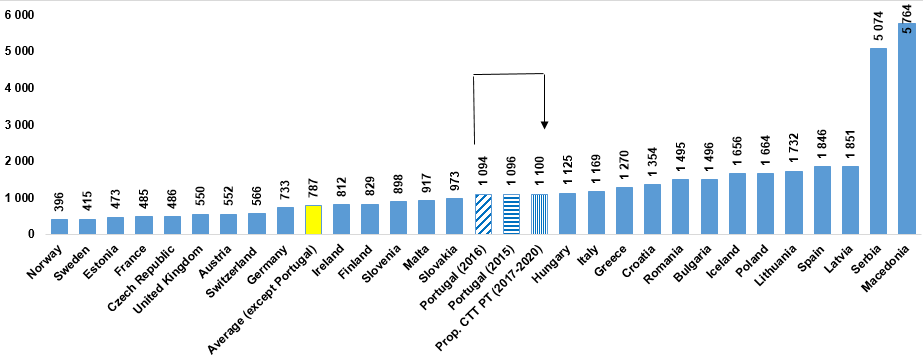
It should be stressed that Portugal is one of the countries of the EU with the highest degree of reduction in the number of letterboxes (comparing 2015 to 2008, the number of letterboxes decreased by 39.6% - vide Figure 6), this trend having been interrupted and inverted in 2014, with the definition of the density objectives currently in force. Even so, Portugal compares unfavourably with the average of countries analysed4 (vide Figure 7).
Figure 6 - Variation in the number of letterboxes between 2008 and 2015
Source: Data from the European Regulators Group for Postal Services.
Figure 7 - Number of inhabitants per letterbox
Source: Data from the European Regulators Group for Postal Services (for 2015) and ANACOM calculations for Portugal (for 2016 and period between 2017-2020).
The reality of each country analysed also reflects obligations in terms of access to letterboxes defined in each country. Annex 1 presents a compilation of the various obligations, as regards the density both of letterboxes and of postal establishments and opening hours.
d) Letterboxes per parish
As referred earlier, CTT proposes to maintain the objective of ensuring one letterbox in every parish, complementing it with the obligation to ensure in every parish at least one point of access to letterboxes for deposit of national standard mail.
This proposal meets ANACOM decision of 05.06.2017, and contributes to the accessibility of users to postal services.
1 “Around 7% of residential users and 12% of business users (micro, small and medium-sized companies), of total customers that used the postal network over the last 12 months, refer they used letterboxes, a value which reaches 17.5% in the case of small companies”.
2 Taking into consideration the most recent data on the evolution of traffic of standard, priority and easy mail services, in the period 2013-2016, for the occasional segment (CTT estimates for 2013, reported to ANACOM in the scope of the price proposal for 2014; data of the cost accounting system of CTT for 2016, received by the end of June 2017).
3 And 59.6% of business users refer they use them at least once a week.
4 Average without Portugal.


