On the Agreement of Quality of Universal Postal Service, celebrated between ANACOM and CTT14https://www.anacom.pt/render.jsp?contentId=55143 on 21/12/00, parameters and minimum levels of quality of service, associated to universal postal service associated to universal postal service provided by CTT, have been established namely those referring to transit times, reliability of service and time in waiting queues at post-offices.
ANACOM verifies every three months the evolution of Indicators of Quality Service (IQS), which were, defined at the Agreement, analysing by end of the year the fulfilment of what has been agreed on the Agreement.
On the graphic representations 2 to 9 are exhibited the levels of quality of service performed by CTT in 200215https://www.anacom.pt/render.jsp?contentId=55144 (non audited figures). From their analysis is noted that the quality of service attained by CTT has surpassed at all times the minimum value of quality of service defined by the Agreement. Nevertheless, in the following situations, the quality of service came short to what has been defined:
- Average time in waiting queue at post-offices (see Graphic 8);
- Average time in waiting queue at post-offices at rush-hour (Graphic 9).
By analysis of graphic 2 we verify that in 2002, 97,4% of non-priority mail shipment were handed over to the addressee up to 3 days after being delivered to a point of mail reception (for example, after dropping the mail at a pillar-box on the public way). This figure is placed above the minimum value and objective of quality of service that has been defined at Agreement of Quality, respectively, 95,1% and 95,9%.
Graphic 2 - Delay on Non-Priority Mail guiding
(Click on the image to see the graphic in a new window)
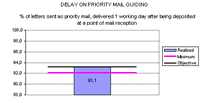
In the same period, the percentage of priority mail dispatched and delivered to the addressee up to 1 day after being deposited in a point of mail reception, was 93,1% (see graphic 3), value similar to the objective value (93,1%) of quality of service defined at Agreement of Quality and, therefore, higher than the minimum value (92,1%).
Graphic 3 - Delay on Priority Mail guiding
(Click on the image to see the graphic in a new window)
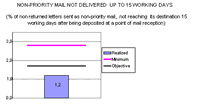
The Agreement stipulates as well, that the number of letters of non-priority mail, not delivered to the addressee up to 15 working days after being deposited at a point of mail reception, should not be higher than 2.8 letters per thousand, being the objective, 1.7 per thousand letters. The figure reached by CTT is 1.2 letters per thousand (see graphic 4), that means, the quality of service reached in 2002 is higher than the one defined at Agreement of Quality.
Graphic 4 - Non-Priority Mail not delivered up to 15 working days
(Click on the image to see the graphic in a new window)
The same conclusion, that is, the quality of service reached in 2002 is higher than the one defined at Agreement of Quality, is drawn up relatively to: priority mail letters not delivered to the addressee up to 10 working days after being deposited in a point of mail reception (see graphic 5); percentage of newspapers, books, periodical publications delivered to addressee up to 3 working days after being deposited in point of mail reception (graphic 6).
Graphic 5- Priority Mail not delivered up to 10 working days
(Click on the image to see the graphic in a new window)
Graphic 6 - Delay on guiding of books, newspapers and periodic publications
(Click on the image to see the graphic in a new window)
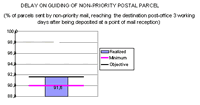
Graphic 7 - Delay on guiding of Non-Priority postal parcel
(Click on the image to see the graphic in a new window)
The quality of service attained on delivery of postal parcels has answered to the objectives defined for 2003 (graphic 7).
Taking into consideration a period, the average time in a waiting queue to be attended at the post-offices, was 4 minutes and 46 seconds (see graphic 8). At rush-hour, that means, an hour at which the affluence to the post-office is higher, the average time in a waiting queue was 7 minutes and 7 seconds (see graphic 9).
Graphic 8 - Time in a waiting queue at post-offices - average (minutes)
(Click on the image to see the graphic in a new window)
Graphic 9 - Time in a waiting queue at post-offices ? rush-hour (minutes)
(Click on the image to see the graphic in a new window)
The IQS (Indicators of Quality Service) defined at the Agreement of Quality, are referred to whole of the national territory. It is noticed on the Autonomous Regions of Azores and Madeira the level of quality of service carried out by CTT, concerning the delay of guiding of non-priority mail (percentage delivered in 3 working days, priority mail (percentage delivered in 1 working day) and regular postal parcels (percentage delivered in 3 working days) have been lower than the ones defined at the Agreement of Quality for the whole of national territory which can be related, possibly, to the physical discontinuity of those regions towards the Mainland and amongst the islands and the implications as far as the availability and transport punctuality are concerned and possible conditioning due to atmospheric adversity.
-----
14 Convention signed between the Instituto das Comunicações de Portugal and CTT - Correios de Portugal, S.A.
https://www.anacom.pt/template12.jsp?categoryId=4009115 Source: CTT


