The main mail services used were sending correspondence (27 percent), sending parcels (13 percent) and express mail (2 percent). Use of different postal services continues to see an overall and statistically significant decline.
|
|
2010 |
2012 |
2014 |
|
Correspondence |
70 |
50↓ |
27↓ |
|
Correio normal (non-priority mail) |
45 |
36↓ |
18↓ |
|
Correio azul (priority mail) |
51 |
29↓ |
14↓ |
|
Correio verde (pre-paid mail) |
15 |
8↓ |
2 *↓ |
|
Registered mail |
42 |
29↓ |
13↓ |
|
Parcels |
26 |
18↓ |
13↓ |
|
Express service |
23 |
6 *↓ |
2 *↓ |
|
None of these postal services |
25 |
45↑ |
70↑ |
Unit: %
Source: ICP-ANACOM, Survey on the use of postal services, December 2010, 2012 and 2014
Base: Individuals aged 15 or over
Note 1: Estimates: (#) Unreliable estimate; (*) Acceptable estimate; (no symbol) Reliable estimate.
Note 2: An upward pointing arrow signals a statistically significant increase between t-1 and t, and a downward pointing arrow signals a statistically significant decline.
Destination of sent correspondence and parcels
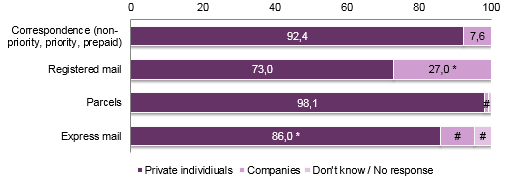
The majority of correspondence and parcels sent by private individuals in 2014 were sent to other private individuals. Companies made up a significant percentage of recipients only in the case of registered mail (27 percent).
Graph 4 - Destination of majority of sent mail

Unit: %
Source: ICP-ANACOM, Survey on the use of postal services, December 2014
Base: Individuals aged 15 or over using respective postal services
Note 1: Estimates: (#) Unreliable estimate; (*) Acceptable estimate; (no symbol) Reliable estimate.
Note 2: An upward pointing arrow signals a statistically significant increase between 2012 and 2014, and a downward pointing arrow signals a statistically significant decline.
User satisfaction with provided services
On a scale of 1 to 10, the average level of satisfaction was reported between 7.8 in the case of Correio verde (pre-paid mail) and 8.3 in the case of Correio normal (non-priority mail). User satisfaction fell for all services between 2012 and 2014. In 2012, only priority mail saw a statistically significant decline in the level of satisfaction.
|
|
|
2010 |
2012 |
2014 |
|
Correspondence |
Correio normal (non-priority mail) |
8,2 |
8,3 |
8,2 |
|
Correio azul (priority mail) |
8,8↑ |
8,5↓ |
8,1↓ |
|
|
Correio verde (pre-paid mail |
8,5 |
8,5 |
7,8↓ |
|
|
Registered mail |
8,7 |
8,4 |
8,1↓ |
|
|
Parcels (in 2012 up to 10 kg) |
8,3 |
8,4 |
8,0↓ |
|
|
Express service |
8,6 |
8,4 |
8,1 |
|
Unit: %
Source: ICP-ANACOM, Survey on the use of postal services, December 2010, 2012 and 2014
Base: .Individuals aged 15 or over using respective postal services (excludes non-responses)
Note 1: The absolute margins of error in the averages on a scale of 1 to 10 do not exceed 0.38 absolute points.
Note 2: An upward pointing arrow signals a statistically significant increase between t-1 and t, and a downward pointing arrow signals a statistically significant decline.
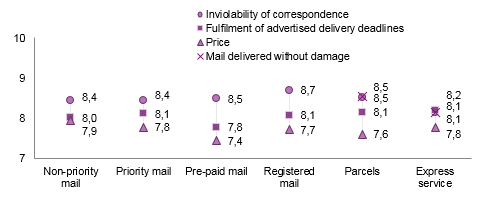
In all postal services under analysis, ''inviolability of correspondence'' is the factor deriving the most satisfaction among customers, followed by ''fulfilment of advertised delivery deadlines'', with ''price'' giving the least satisfaction. As far as the parcel service is concerned "mail delivered without damage" and ''inviolability of correspondence'' are the factors providing most satisfaction (with the same average level).
Graph 5 - Average level of satisfaction with postal services according to different aspects

Unit: Scale 1 (very dissatisfied) to 10 (very satisfied)
Source: ICP-ANACOM, Survey on the use of postal services, December 2014
Base: Individuals aged 15 or over using respective postal services (excludes non-responses)
Note: Estimates: (#) Unreliable estimate; (*) Acceptable estimate; (no symbol) Reliable estimate.


