Subscription television signal distribution servicehttps://www.anacom.pt/render.jsp?contentId=1473511
At the end of the 2018, there were around 3.9 million subscribers to the subscription TV signal distribution service, 3.7% more than in 2017. The services supported by fibre optic (FTTH) were those that contributed the most to increasing the number of subscribers. Fibre optic represented 41.4% of total subscribers, being the technology with the largest number of subscribers.
Trends in total number of TV subscription signal distribution service subscribers, per technology
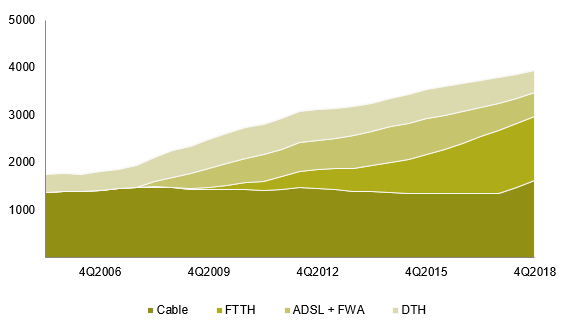
Unit: thousands of subscribers
Source: ANACOM
The percentage of homes with subscription TV signal distribution service with access to premium channels (15.8%) has been decreasing significantly. The lowest value since this type of information has been collected was recorded in the 3rd quarter of 2018 (14.2%).
Access to premium channels
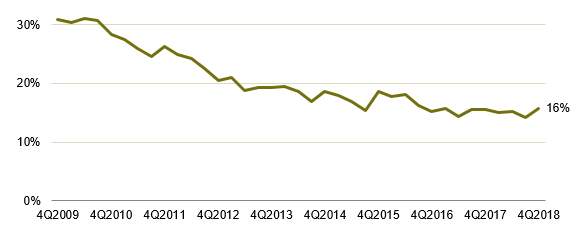
Unit: %
Source: ANACOM based on microdata from the Marktest BTC, 4Q2009 to 4Q2018
Note: homes with pay TV (total); does not include non-responses
Postal serviceshttps://www.anacom.pt/render.jsp?contentId=1473497
In 2018, postal traffic decreased by 5.9%, to reach 734 million objects. The reduction of total traffic was due to the reduction in traffic from letters, editorial mail and direct mail, which was partially compensated for by the increase of 10.2% shown in parcel traffic.
Total postal traffic in 2018 - by type of object
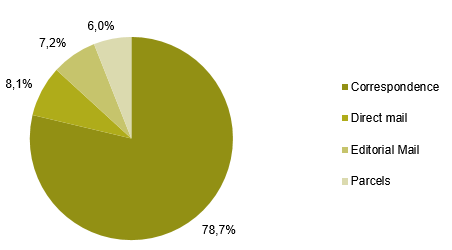
Unit: %
Source: ANACOM
In 2018, around 82.6% of revenues corresponded to postal services understood as forming part of the universal service.
Weight of universal service in total traffic
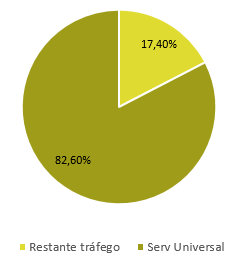
Unit: %
Source: ANACOM
Fixed location Internet access servicehttps://www.anacom.pt/render.jsp?contentId=1473488
In 2018, the number of fixed broadband accesses grew by 5.9%, translated into 210 thousand accesses, reaching 3.8 million at the end of the year. Optical fibre (FTTH) was the main form of fixed broadband Internet access (45.2% of accesses). Cable and ADSL had 31.2% and 16% of fixed broadband Internet accesses, respectively. LTE at a fixed location had 7.5% of the total of accesses.
Trends in the number of fixed broadband accesses, per technology
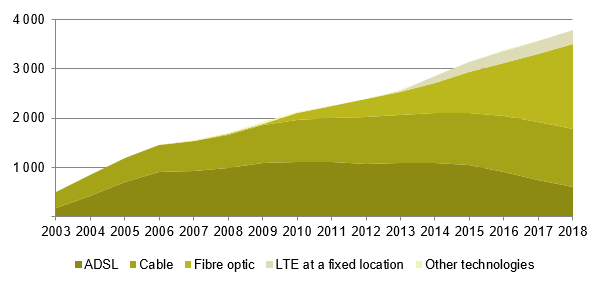
Unit: thousands of accesses
Source: ANACOM
It is worth noting the speed ranges defined in the “Digital Agenda for Europe” goals, where approximately 79.7% of users had accesses of at least 30 Mbps and 71.6% used access speeds equal to or greater than 100 Mbps.
Trends in the number of fixed broadband accesses, per download speed
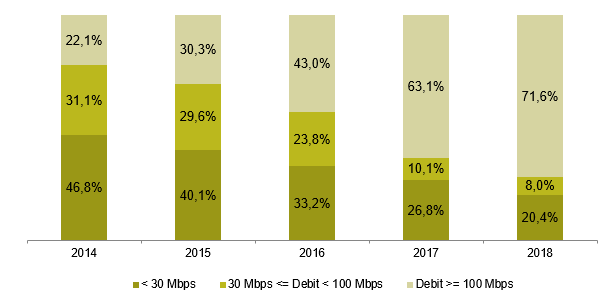
Unit: %
Source: ANACOM
In 2018, broadband Internet access traffic at a fixed location totalled 4.6 million TB, which represents a growth of 49% compared to the previous year.
Fixed broadband internet access traffic 2018
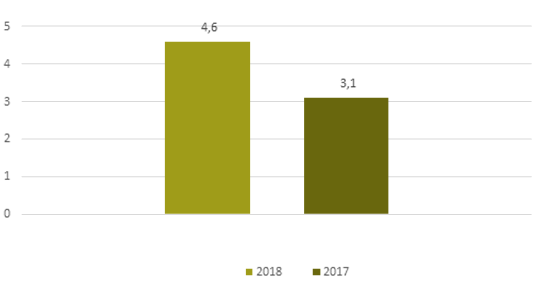
Unit: millions TB
Source: ANACOM
Mobile serviceshttps://www.anacom.pt/render.jsp?contentId=1473492
The number of mobile accesses authorised to use the service reached 17.5 million. Of these, 12.4 million (70.5% of the total) were actually used (excluding M2M).
Trend in the number of active mobile accesses and with actual use
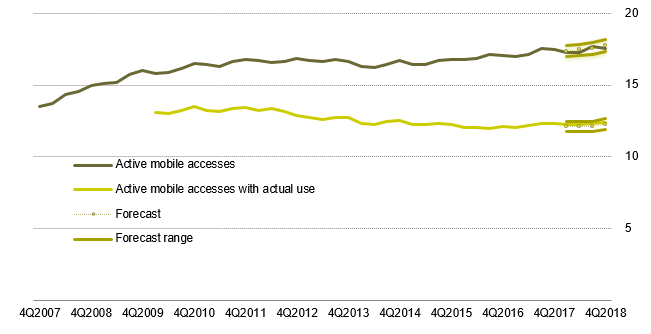
Unit: millions of mobile accesses
Source: ANACOM
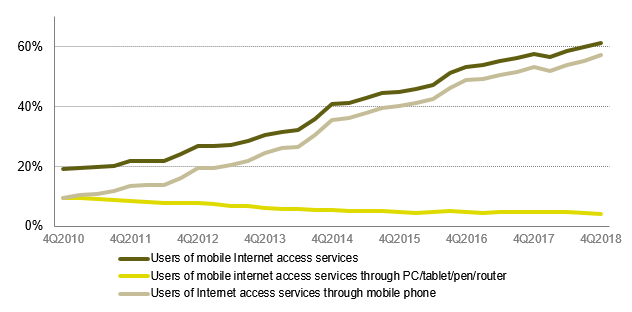
Actual users of the mobile Internet access service reached 7.6 million, 6.4% more than in the previous year. This is the highest figure recorded to date, but still well below the European average (27th position in the EU28 ranking in July 2018).
Evolution of the proportion of mobile broadband Internet service users
Unit: %
Source: ANACOM
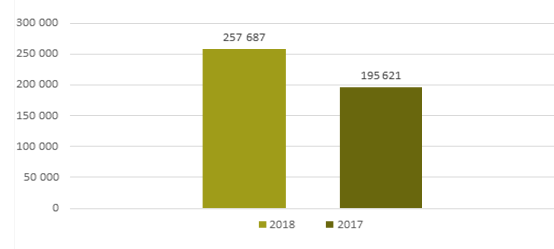
In 2018, mobile broadband Internet access traffic totalled 258 million TB, 31.7% more compared to the previous year.
Mobile broadband traffic
Unit: TB
Source: ANACOM
Note: Includes Internet access traffic, outside Portugal (Roaming OUT)
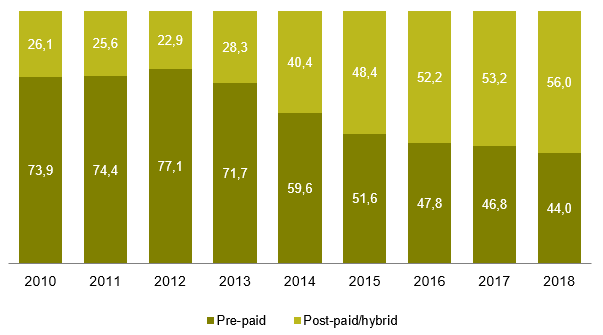
At the end of 2018, 44% of mobile accesses with actual use were associated with pre-paid plans, a reduction of 2.8 percentage points compared to the end of the previous year. As such, the downward trend in the weighting of pre-paid tariffs recorded since the start of 2013 was maintained. In contrast, the proportion of post-paid/hybrid tariffs rose.
Distribution of subscribers by type of tariff plan
Unit: %
Source: ANACOM
High-speed networks
It is estimated that in 2018, the coverage of high-speed networks at a fixed location reached at least 81.2%, 5.4 percentage points more than the end of the previous year.
Percentage of coverage of households with high-speed networks at a fixed location
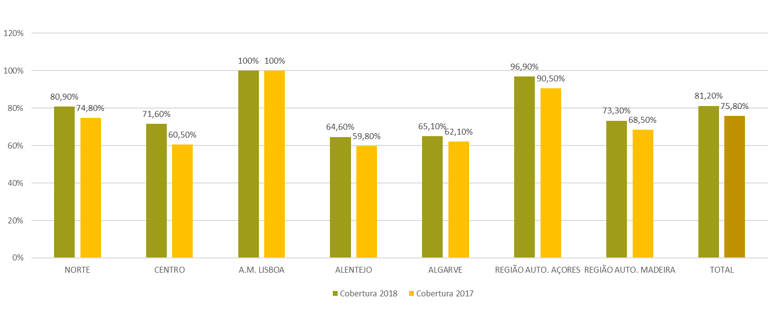
NORTH, CENTRE; M.A. LISBON, ALENTEJO, ALGARVE, AUTON. REGION AZORES; AUTON. REGION MADEIRA, TOTAL
Coverage 2018
Coverage 2017
By the end of 2018, the number of residential customers with high-speed services at a fixed location rose to around 2.5 million, 10.9% more than that recorded in the previous year.
Residential customers of high-speed services at a fixed location
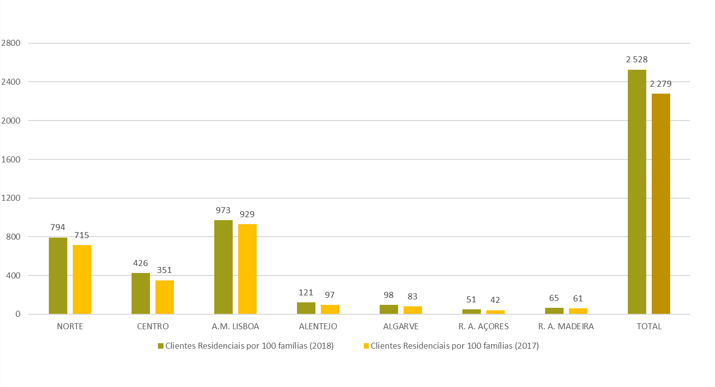
NORTH, CENTRE; M.A. LISBON, ALENTEJO, ALGARVE, AUTON. REGION AZORES; AUTON. REGION MADEIRA, TOTAL
Residential Customers per 100 families (2018)
Residential Customers per 100 families (2017)
Unit: Thousands of private family members
Source: ANACOM
Bundled serviceshttps://www.anacom.pt/render.jsp?contentId=1473481
The number of subscribers to bundled offers reached 3.88 million at the end of 2018, a growth of 145 thousand customers, or 3.9% more than the values recorded in 2017. The value recorded is within the forecast range.
Trend in the number of bundled services subscribers and forecast range
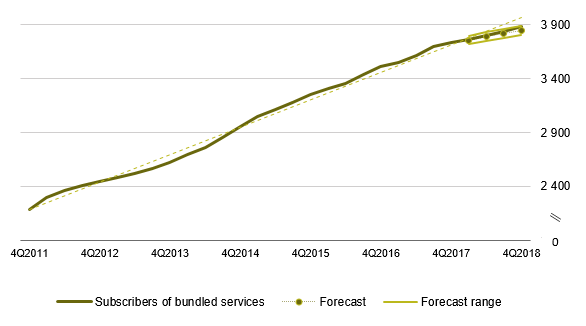
Unit: thousands of subscribers
Source: ANACOM
Note: For the purposes of modelling this series, a non-linear logistic model was used Y=2,118,340+1,890,242/(1+exp(-0.165*(t-12,696))). The modelling was carried out as of the second quarter of 2012. Forecast range with a significance level of 95% and adjusted R2 of 0.998.
At the end of 2018, the 4/5P bundles continued to be the most used, with 1.8 million subscribers (46.3%), followed by the 3P bundle, with 1.62 million subscribers (41.7%)
Distribution of the number of subscribers of bundled services by type of offer, 4Q2018
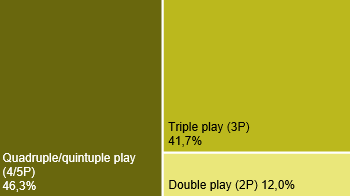
Unit: %
Source: ANACOM
Fixed telephone servicehttps://www.anacom.pt/render.jsp?contentId=1473484
At the end of 2018, the number of direct access fixed telephone service customers reached 4 million, a value 2.3% higher than that recorded in the previous year, and slightly above the forecast range.
Trends in direct access customers and forecast range
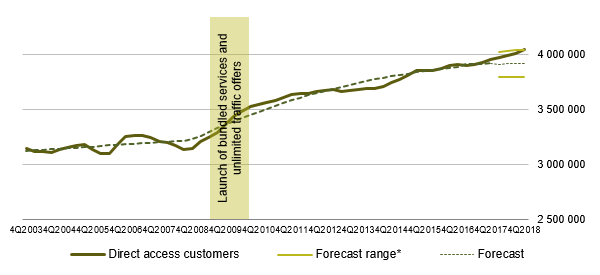
Unit: number of customers
Source: ANACOM
Note 1: Forecast range with a significance level of 95%.
Note 2: Between 4Q2003 and 3Q2008, the series showed the following linear trend: Y=4,865t. From 4Q2008 onwards, following the introduction of offers, particularly as a bundle, with traffic included, became quadratic (Y = 3,203,413 + 33,862 t - 401 t2). The adjusted R2 for the model was 0.95.
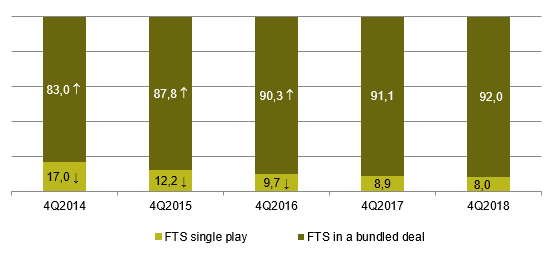
The growth registered in the fixed telephone service has been linked to the growing popularity of bundled offers which include fixed telephone. About 92% of fixed telephone service customers had purchased this service as part of a bundle.
Households with FTS included in their bundle
Unit: %
Source: ANACOM, based on microdata from the Marktest BTC, 4Q2014 to 4Q2018
Note: Total homes with FTS (does not take into account non-responses).
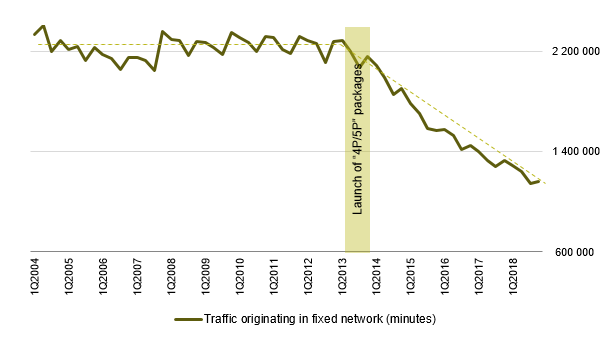
Total traffic originating in the fixed network in minutes decreased by 9.4% in 2018. This decrease is explained by the reduction in fixed-fixed national traffic (-9.2% in number of minutes). This trend is due to the increase in the penetration of “4P/5P” bundles, which include mobile services with free calls to all networks and, also, the growing penetration of new forms of communication supported on the Internet.
Traffic originating in the fixed network (minutes) and forecast range
Unit: thousands of minutes
Source: ANACOM
Consult the statistical report:
- Subscription television signal distribution service - 2018 https://www.anacom.pt/render.jsp?contentId=1473511
- Postal services 2018 https://www.anacom.pt/render.jsp?contentId=1473497
- Internet access service at a fixed location 2018 https://www.anacom.pt/render.jsp?contentId=1473488
- Mobile services - 2018 https://www.anacom.pt/render.jsp?contentId=1473492
- Bundled services for electronic communications 2018 https://www.anacom.pt/render.jsp?contentId=1473481
- Fixed telephone service 2018 https://www.anacom.pt/render.jsp?contentId=1473484


