Postal services: level of use and service's quality perception levels
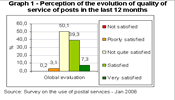
1. Almost half the users of postal services in Portugal (about 46.6%) are ''satisfied'' or ''very satisfied'' with the evolution of the quality of service of posts in the last twelve months.
Only 3.1% of inquired users are ''not satisfied'' with the evolution of the quality of posts.
Graph 1 - Perception of the evolution of quality of service of posts in the last 12 months

(Click here to see the full-size image)
2. Normal mail is the most used postal service. About 68 per cent of those interviewed use this service. It is followed by priority mail, which is used by 57.4 per cent of those interviewed.
The rate of registered mail and mail orders users is quite low.
| Normal Mail | 67.9% |
| Blue (Priority) Mail | 57.4% |
| Registered Mail | 28.0% |
| Mail orders | 20.4% |
| Postal orders and invoicing | 14.7% |
| Express Mail | 7.2% |
| Green Mail | 7.6% |
| Economic Mail | 0.7% |
| Documents exchange Centres | 0.3% |
| None | 6.8% |
| Nr/Na | - |
Source: Survey on the use of postal services - Jan 2006
3. According to the survey, each interviewed person receives per month 14.7 ''letters, direct mail'' and 1 mail order.
| Letters, addressed advertising, etc. | 14.7 |
| Received mail orders | 1 |
Source: Survey on the use of postal services - Jan 2006
4. Most of those interviewed say that mail delivery in their area is made on a daily basis, regardless of their area.
| North | Centre | Lisbon | Alentejo | Algarve | Azores | Madeira | Total | |
|---|---|---|---|---|---|---|---|---|
| Every day | 97.5% | 100.0% | 99.2% | 98.5% | 97.0% | 100.0% | 94.7% | 98.6% |
| Every two days | 2.5% | 0.0% | 0.4% | 1.5% | 3.0% | 0.0% | 5.3% | 1.3% |
| Longer | 0.0% | 0.0% | 0.4% | 0.0% | 0.0% | 0.0% | 0.0% | 0.1% |
Source: Survey on the use of postal services - Jan 2006
5. The ''no non-addressed advertising here, please'' sticker is placed on 15.9% of mail boxes, 3.6 per cent more than in June 2005. The sticker is respected in 53.9% of the cases.
| Has sticker | Sticker respected | |||
|---|---|---|---|---|
| 2006 | 2005 | 2006 | 2005 | |
| Yes | 15.9% | 12.3% | 53.9% | 49.3% |
| No | 81.6% | 85.8% | 38.6% | 44.0% |
| Nr/Na | 2.5% | 1.9% | 7.5% | 6.7% |
Source: Survey on the use of postal services - Jan 2006 and Jun 2005
Post offices and postal agencies
6. In post offices, ''sending normal correspondence'' is the most used service (86.4 per cent). Sending packages is made by 17.6% of those interviewed.
| Sending correspondence (normal, priority, ...) | 86.4% |
| Sending mail orders | 17.6% |
| Payment of services | 23.1% |
| Receiving registered mail | 21.3% |
| Buying stamps | 20.6% |
| Using the phone | 9.8% |
| Receiving mail orders | 14.9% |
| Postal orders | 10.4% |
| Postal invoicing | 6.2% |
| Mail boxes | 1.3% |
| Payment of taxes | 3.8% |
| Charging mobile phones | 4.5% |
| Buying transportation tickets | 2.5% |
| Corfax | 0.9% |
| Internet access | 0.5% |
Source: Survey on the use of postal services - Jan 2006
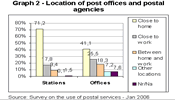
7. Post offices are used mainly ''close to home'' (71.2 per cent)
Postal agencies have a more dispersed use, with 41.1% using them close to home and 25.5% ''close to work''.
Graph 2 - Location of post offices and postal agencies

(Click here to see the full-size image)
8. The three most important items in post offices are ''efficiency of staff'' (23.6 per cent) followed by ''time waiting to be attended'' (21.4%) and ''opening hours'' (19.5%).
| Efficiency of staff | 23.6% |
| Time waiting to be attended | 21.4% |
| Opening hours | 19.5% |
| Location | 12.8% |
| Organization of the attending lines | 12% |
| Accessibility for persons with special needs | 8.9% |
| Displayed information | 1.8% |
Source: Survey on the use of postal services - Jan 2006
In postal agencies efficiency is also the most important item (21.1%) but ''location'' and ''opening hours'' are ahead of ''time waiting to be attended'', which is one of the main items in post offices.
| Efficiency of staff | 21.1% |
| Time waiting to be attended | 20.5% |
| Opening hours | 19.7% |
| Location | 18.4% |
| Organization of the attending lines | 11.0% |
| Accessibility for persons with special needs | 7.0% |
| Displayed information | 2.4% |
Source: Survey on the use of postal services - Jan 2006
9. The waiting time is the item that mostly leads to lack of satisfaction within the users of post offices. About 17.8% of those interviewed say that they are ''poorly satisfied'' or ''not satisfied'' with the waiting time at post offices.
Graph 3 - Evaluation of post offices

(Click here to see the full-size image)
It should be noted that, according to the collected data, 54.6% of those interviewed wait 10 minutes or less in post offices. This rate rises to 61% in postal agencies.
The average waiting time is 15 minutes in post offices and 12 minutes in postal agencies.
| Offices | Agencies | |
|---|---|---|
| 21.6% | 31.9% | |
| 10 minutes | 33.0% | 29.1% |
| >10 minutes | 44.4% | 30.3% |
| Average time | 15 minutes | 12 minutes |
Source: Survey on the use of postal services - Jan 2006
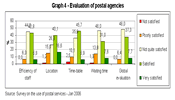
10. In postal agencies ''location'' is the reason behind most non-satisfaction, with 16.2% of users ''poorly satisfied'' or ''not satisfied''.
Graph 4 - Evaluation of postal agencies

(Click here to see the full-size image)
11. The replacement of some post offices by postal agencies is known by 36.2% of those interviewed, 17.1 per cent more than in June 2005.
Of those stating to be aware of the replacement, 47.3% consider that the quality level of the public service has decreased.
| Jan 2006 | Jun 2005 | |
|---|---|---|
| Is aware | 36.2% | 19.1% |
| Does not know | 61.8% | 71.7% |
| NR/NA | 2.0% | 9.2% |
| Quality was kept | 32.4% | 28.7% |
| Not kept | 47.3% | 41.1% |
| NR/NA | 20.3% | 30.1% |
Source: Survey on the use of postal services - Jan 2006 and Jun 2005
Complaints
12. 9.7% of those interviewed have already filed a complaint at post offices.
The main reasons for complaint were ''delivery at wrong address'' and ''delay in delivery''. 11% complained about ''loss of object''.
The average answering time to the complaint fell from 11 to six days, from June 2005 to January 2006.
| Jan 2006 | Jun 2005 | |
|---|---|---|
| Complaints: | 9.7% | 6.7% |
| Reason: | ||
| Delivery at wrong address | 33.4% | 41.7% |
| Delay in delivery | 31.6% | 22.2% |
| Loss of object | 11.0% | 16.7% |
| Misunderstanding with the mail person | 8.6% | 8.3% |
| Poor state of the object | 1.2% | 5.6% |
| Other | 9.4% | 6.9% |
| NR/NA | 4.9% | - |
| Time waiting for answer: | 6 days | 11 days |
Source: Survey on the use of postal services - Jan 2006 and Jun 2005
Comparisons between operators
13. CTT Expresso/Post Log stands in first place for awareness. 55.4% of those interviewed recognised this company from the list of operators provided by the interviewer.
It is followed by DHL with 48.3 per cent of awareness.
CTT Expresso/Postlog also stands out on use, with 11.2 per cent.
| Awareness | Use | |
|---|---|---|
| CTT Expresso/Post Log | 55.4% | 11.2% |
| DHL | 48.3% | 6.5% |
| TNT | 30.3% | 1.8% |
| Chronopost | 24.6% | 3.8% |
| UPS | 20.6% | 1.3% |
| FED EX/Rangel Expresso | 11.8% | 1.0% |
| Ibercourier/MRW | 7.3% | 0.2% |
| GL Transportes/Guipuzcoana | 7.2% | 0.7% |
| Logistas Transportes e Transitários | 5.9% | 0.9% |
| None | 24.4% | 79.6% |
| NR/NA | 1.3% | 2.3% |
Source: Survey on the use of postal services - Jan 2006
Postal services and new information and communications technologies
14. The survey showed that those using the Internet receive in average one more mail orders per month than non users. Regarding letters (normal, express and priority mail), the difference is only 1 object.
| Letters | Mail orders | |
|---|---|---|
| Does not use Internet | 14.4 | 0.7 |
| Uses Internet | 15.4 | 1.8 |
Source: Survey on the use of postal services - Jan 2006
Methodology:
The universe defined for this survey was made up of users of at least one postal service in Mainland Portugal and in the autonomous regions of Madeira and the Azores.
The sample size was defined in order to assure a maximum error of 3.5% for the main results (for a confidence level of 95%).
The sample was stratified by NUTS II based on the last General Population Census: 2001 Census.
920 face-to-face and direct interviews were made. Later, a telephone collection (CATI) of 320 observations was made to assess the usage rate of postal services.
The field work took place between 9 and 26 January and was carried out by Consulmark


