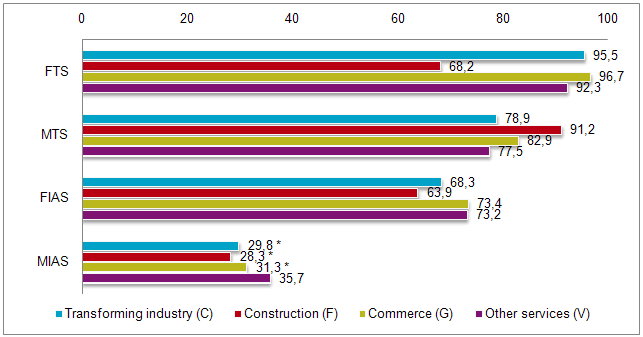
In most sectors, penetration of the telephone service at a fixed location exceeds 90 percent. The exception is the Construction subsector, where this service has less than 70 percent penetration, with fixed Internet reported at rates that are significantly lower. In contrast, when it comes to the mobile telephone service, the Construction subsector has the highest penetration rate (91.2 percent)
Internet penetration increased across the board compared to 2007. In the specific case of the mobile Internet, penetration is reported at close to 30 percent, with the highest level of penetration reported in the “other services” subsector (36 percent).
Graph 2 - Possession of services by sector of activity

Unit: %.
Source: ICP-ANACOM, Survey on the use of electronic communications services by small and medium-sized enterprises, December 2010
Base: All companies with less than 250 staff according to sector of activity
Note: Estimates: (#) Unreliable estimate; (*) Acceptable estimate; (no symbol) Reliable estimate (see Footnote 2).
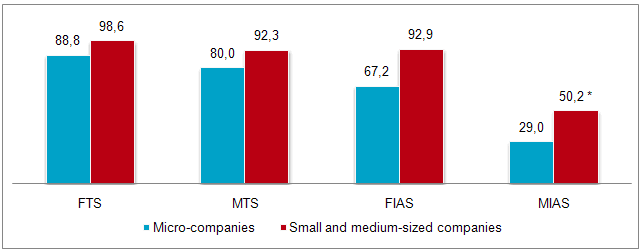
Compared to penetration of electronic communication among micro-companies, penetration among small and medium-sized companies is higher for all of the services, especially for Internet access services.
Graph 3 - Penetration of services by size of company

Unit: %.
Source: ICP-ANACOM, Survey on the use of electronic communications services by small and medium-sized enterprises, December 2010
Base: All companies with less than 250 staff according to size
Note 1: Estimates: (#) Unreliable estimate; (*) Acceptable estimate; (no symbol) Reliable estimate (see Footnote 2).
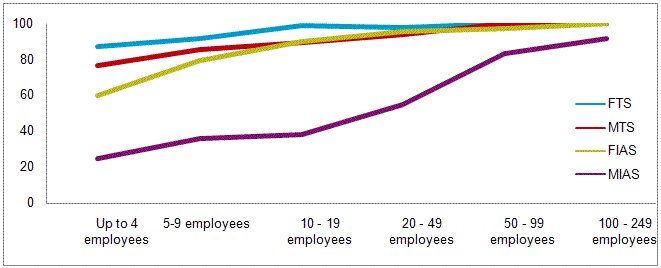
A more detailed analysis of electronic communication services according to company size shows that possession tends to increase in line with the size of the company. This is especially true in the case of Internet access services (particularly mobile).
Graph 4 - Possession of services by size of company

Unit: %.
Source: ICP-ANACOM, Survey on the use of electronic communications services by small and medium-sized enterprises, December 2010
Base: All companies with less than 250 staff according to company size
Note: Estimates: (#) Unreliable estimate; (*) Acceptable estimate; (no symbol) Reliable estimate (see Footnote 2).


