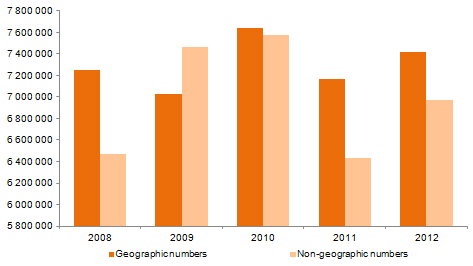
The following tables contain data on trends in the allocation of rights of use of numbering since 2008, including the volume of numbers arising from the allocations made during 2012, and the volume of recovered numbers.
|
Year |
Allocated and/or |
Geographic numbers1 |
|||
|
Lisbon |
Geographic |
Other geographical |
Totals |
||
|
2008 |
A |
190 000 |
70 000 |
1 040 000 |
1 300 000 |
|
R |
10 000 |
10 000 |
590 000 |
610 000 |
|
|
2009 |
A |
180 000 |
60 000 |
30 000 |
270 000 |
|
R |
0 |
0 |
490 000 |
490 000 |
|
|
2010 |
A |
280 000 |
160 000 |
170 000 |
610 000 |
|
R |
0 |
0 |
0 |
0 |
|
|
2011 |
A |
20 000 |
0 |
20 000 |
40 000 |
|
R |
20 000 |
20 000 |
470 000 |
510 000 |
|
|
2012 |
A |
30 000 |
20 000 |
200 000 |
250 000 |
|
R |
0 |
0 |
0 |
0 |
|
Source: ICP-ANACOM.
|
Year |
Allocated and/or |
Nomadic VoIP |
Short |
Translation and |
Data Services |
MTS6 |
Totals7 |
|
2008 |
A |
290 000 |
5 |
164 503 |
300 |
2 600 000 |
3 054 808 |
|
R |
50 000 |
8 |
140 000 |
400 |
350 000 |
540 408 |
|
|
2009 |
A |
70 000 |
4 |
0 |
0 |
1 500 000 |
1 570 004 |
|
R |
120 000 |
6 |
160 000 |
0 |
0 |
580 006 |
|
|
2010 |
A |
100 000 |
0 |
21 100 |
0 |
0 |
121 100 |
|
R |
0 |
2 |
10 000 |
0 |
0 |
10 002 |
|
|
2011 |
A |
10 000 |
0 |
10 000 |
0 |
0 |
20 000 |
|
R |
20 000 |
6 |
140 000 |
0 |
1 160 006 |
||
|
2012 |
A |
10 000 |
1 |
10 000 |
0 |
600 000 |
620 001 |
|
R |
20 000 |
4 |
60 000 |
200 |
0 |
80 204 |
Source: ICP-ANACOM.
An outline is given below of the cumulative values of numbers assigned nationally since 2008, with a reversal in the reduction in numbers in 2011. This is due to stabilization in the situation resulting from the introduction of numbering fees in 2009 and the absence of corporate mergers and dissolutions during this period. The increased volume of non-geographic numbers allocated in 2012 results from the emergence of new MTS providers.
The number of short numbers allocated in 2009 was amended from two to four.
|
Year |
Geographic |
Non-geographic |
|
2008 |
7 250 000 |
6 474 055 |
|
2009 |
7 030 000 |
7 764 053 |
|
2010 |
7 640 000 |
7 875 151 |
|
2011 |
7 170 000 |
6 735 145 |
|
2012 |
7 420 000 |
7 274 942 |
Source: ICP-ANACOM.
Graph 32. Accumulated value of numbers allocated nationally

Source: ICP-ANACOM.
1 Numbers are allocated in blocks of 10,000, except in the 80080 range, where numbers are allocated individually. Translation services are provided using the 707, 708, 760, 761, 762, 800, 808 and 809 ranges of the NNP, while the voice mail service is provided in the 600 range.
2 VoIP - Voice over Internet Protocol.
3 Corresponds to the 10xy, 116xyz, 14x (y), 15xy, 16xyz and 18xyz ranges. Numbers are allocated individually, except in the 116xyz range, where numbers are allocated in blocks of 10.
4 Numbers are allocated in blocks of 10 000, except in the 80080 range, where numbers are allocated individually. Translation services are provided using the 707, 708, 760, 761, 762, 800, 808 and 809 ranges of the NNP, while the voice mail service is provided in the 600 range.
5 Numbers are allocated in blocks of 100, with the last three digits set at zero for 67 range (data services).
6 Numbers are allocated in blocks of 10 000, except in the 92 range. Rights of use of numbering are allocated implicitly for the ''609'' and ''669'' range for access to the voicemail service, respectively, mail box consultation and message leaving, and the ''639'' and ''659'' numbering range, respectively, for access to mobile fax and data services.
7 The totals do not include the numbers returned from the Mobile Trunking Service (300 000 and 1 000 000 numbers respectively in 2009 and 2011).


