According to the study ?Perception of Quality of Postal Services? relating to year 2002 1, promoted by ANACOM, is noticed:
1. Concerning the use of post-offices and remaining postal infra-structures:
a) The majority of the interviewed people has declared to go to the post-office seldom (37%), or just two to three times a month (26%);
b) Approximately 60% of the inquired people choose a post-office next to the residential area, while 15% choose the post-office near to their working place. Those who decide to walk into a post-office away from their residence/work area, 25% declare not be able to locate easily the post-offices.
c) The greater influx of people into the post-offices are registered between 9h and 12h (40% for the whole country and 90% for the Autonomous Regions). Approximately 85% of the inquired people consider the working timetable at post-offices, to be adequate. In terms of preference, other working timetables for the post-offices2 are considered, mainly, Saturday morning (41%), lunch time (29%) and late afternoon up to 20h (28%);
d) The most used services are related to sending mail and the payment of services. About 42% of the inquired people consider the existing services at post-offices to be enough.
e) About 68% of the inquired people can not find with easiness the automatic stamps selling machines;
f) In the Autonomous Regions, 45% of the inquired people has considered the number of receiving posts (post-offices and pillar-boxes) not enough.
2. Relatively to the use of postal services, has been noticed:
a) About 50% of inquired individuals send 1 or less letters per month. Note that 14% of the those inquired do not send correspondence. The main reason indicated for this reduced use of postal services is the preference for the utilization of the telephone (55%);
b) About 54% of the inquired people make use of the parcels service of the post offices;
Taking into account the conclusions of the above study, ANACOM has advised CTT, namely, that:
a) Should be promoted the disclosure of the patterns, concerning the delay of blue and non-priority mail guiding, the gathering times on the pillar and mail boxes and fixing information on regular pillar and mail boxes, directing the priority mail to a particular pillar and mail boxes;
b) Should be promoted the use of free telephone service for user support and CTT site at Internet, as well as to disclose in a stronger way the access to the complaint service;
c) In order to reduce time in a waiting queue at the post-offices, the sales of stamps outside the post-offices should be promoted, namely, when suitable, through automatic stamps selling machines;
d) Should be studied the possibility of reorganizing the number of correspondence gathering points and disclosed, by proper means, the actual existing gathering points.
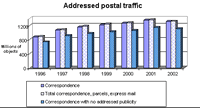
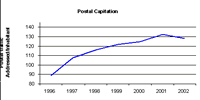
In spite of weak utilization of postal services, marked out by the answers of inquired people to the present study, it was noticed a tendency for growth on demand for postal services up to 2001, as can be seen on graphics 11 and 12. Nevertheless, from 2001 it was noted an inversion of that tendency as the addressed postal traffic has decreased by 3,5%.
Graphic 11 - Addressed postal traffic
(Click on the image to see the graphic in a new window)
Source: CTT
In 2002, each inhabitant in average, made 128 addressed postal dispatches.
Graphic 12 - Postal capitation
(Click on the image to see the graphic in a new window)
1 See Perception of Postal Service Quality 2002 (publication August 2002)https://www.anacom.pt/render.jsp?contentId=678661.
2 Allows multiple answers.


