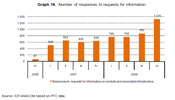
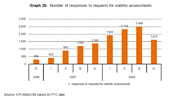
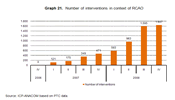
2008 was characterized by an increase in the interest of operators in the use of the RCAO, which resulted in an increasing number of responses to requests for information on conduits and associated infrastructure, the number of responses to requests for viability assessments and the number of interventions in the conduits of PTC, as shown in the graphs below.
Graph 19. Number of responses to requests for information
Graph 20. Number of responses to requests for viability assessments
Graph 21. Number of interventions in context of RCAO
Of ICP-ANACOM's intervention during 2008, note should be made of the determinations in the context of resolving specific situations and continued monitoring of the quality of service provided.
In this context note is made of the determination of 12 March 2008, by which ICP-ANACOM adopted a decision on access for beneficiaries of the RCAO to PTC's conduit database, whereby it was determined that PTC shall maintain both systems of providing information on conduits and associated infrastructure (through access to an Extranet and using forms with plans provided in PDF format by email) for a further period of three months, after which period information on conduits may be accessed exclusively through the RCAO Extranet.
Furthermore, in the context of the access of beneficiaries of the RCAO to PTC's conduit database, ICP-ANACOM adopted by determination of 6 August 2008, the maximum price of the service of access to the database, based on an annual price per district and per beneficiary that is substantially below the price previously established by PTC.
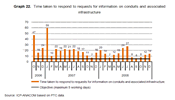
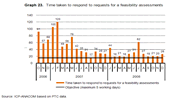
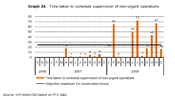
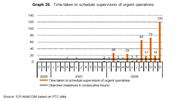
In terms of monitoring the levels of quality of service provided by PTC, it was found that although there was an improvement over past levels, values remained at levels that were incompatible with the objectives. This is under separate review.
Graph 22. Time taken to respond to requests for information on conduits and associated infrastructure
Graph 23. Time taken to respond to requests for a feasibility assessments
Graph 24. Time taken to schedule supervision of non-urgent operations
Graph 25. Time taken to schedule supervision of urgent operations
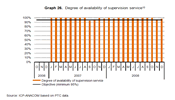
Graph 26. Degree of availability of supervision service 1
In this respect, it should be noted that the non-compliant situation persists regarding the availability of information concerning the occupation of conduits.
1 This indicator is calculated based on the number of supervisions conducted on the dates that the concessionaire committed to, compared to the total number of supervisions conducted.

